Garbage Time — How Blowouts Distort NBA Prop Settlement on Both Sides
 Available in US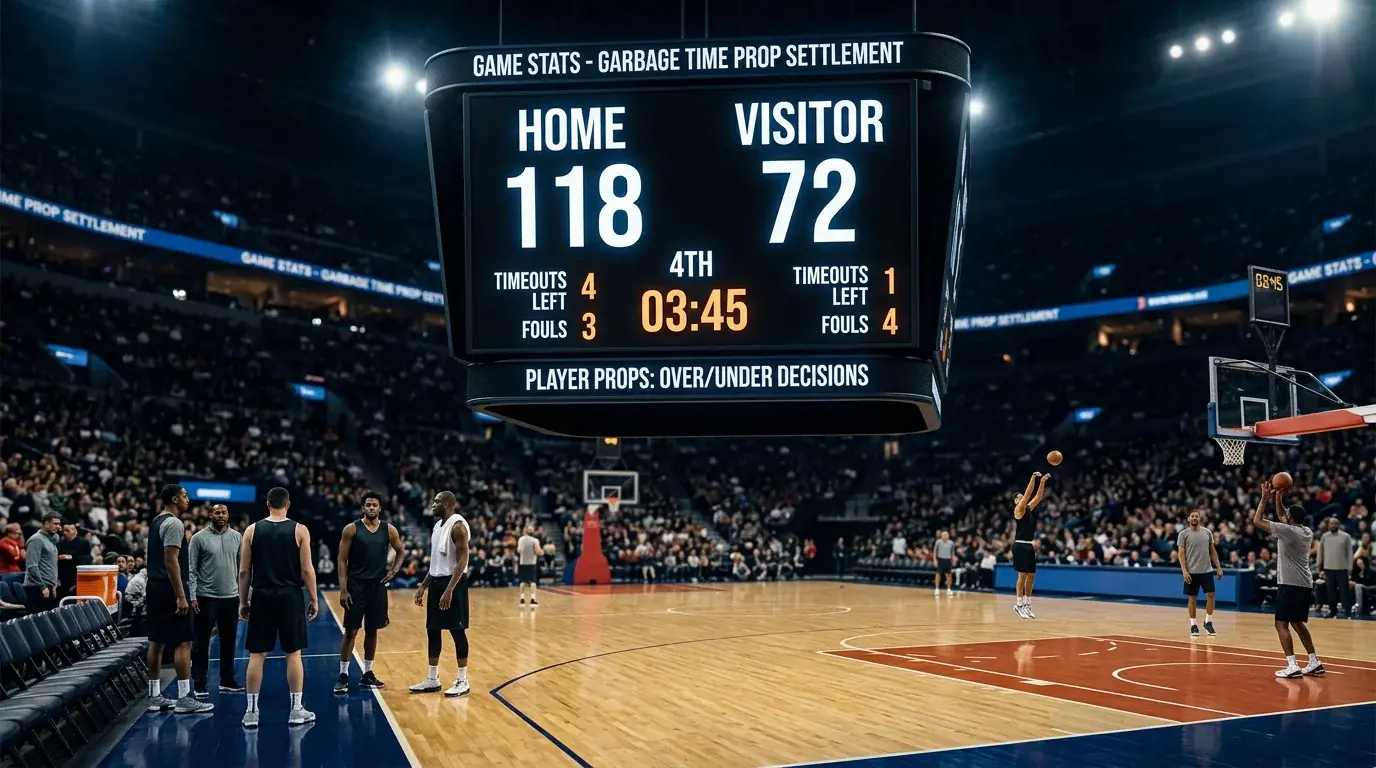
Garbage time is the invisible dividing line between prop bets that settle as projected and prop bets that miss for reasons unrelated to the player’s actual performance. A starter on track for a comfortable over through three quarters can have his settlement collapsed by a blowout that pulls him in the fourth. A bench player buried for the first three quarters can settle his over because of garbage-time minutes that nobody projected. Both scenarios are common enough across an NBA season that any prop research workflow that does not account for them is leaving meaningful money on the table.
Table of Contents
- The mechanics of how starters lose minutes
- The bench-cascade upside on under bets
- The ‘garbage time’ definition that prop punters need
- Quarter-specific props and the garbage-time amplifier
- The competitive-game premium nobody calculates
- The starter-pull pattern by team and coach
- Why this layer of research is worth the work
The mechanics of how starters lose minutes
When the score margin in the fourth quarter exceeds 15 points, coaches start pulling starters. By the 5-minute mark of a 20-point blowout, the starting unit is usually gone for the night. The starter projected for 32 minutes finishes on 27 or 28. The 11.5 rebounds line that priced his projected 32 minutes settles at 9 or 10 because the closing minutes never arrived.
The math is straightforward. A starter producing at his average rate across 28 minutes instead of 32 produces roughly 12.5 per cent less stat output. On a points line that priced 24.5, the projected output drops from around 26 to around 22.7. On a rebounds line that priced 10.5, the projected output drops from around 11.2 to around 9.8. Both overs that looked comfortable at tip-off die because of game flow rather than player performance.
The probability of a blowout is not random. The closing-line spread is a sophisticated forecast of game flow and the spread predicts blowout probability with reasonable accuracy. A spread above eight points carries roughly 25 per cent blowout probability — defining blowout as final margin above 15. A spread above twelve carries roughly 40 per cent. A spread under five carries roughly 8 per cent. The variation is large enough to matter for prop pricing, and operator models build it into their projections — but the building is incomplete and the residual edge is real.
The bench-cascade upside on under bets
When starters get pulled, bench players play more minutes. The cascade produces opportunity for under bets on starters and over bets on bench rotation pieces. A back-up centre projected for 16 minutes who plays 25 minutes in a blowout because the starter sits the fourth quarter has an opportunity profile that operator pricing did not project. His rebounds, his points, his blocks all climb materially above the baseline projection.
The bench-cascade overs are particularly attractive when the back-up is a prop with limited line history. Operator pricing models lean on rolling averages, and a back-up whose minutes are usually compressed has a small sample of high-minute games to draw projection from. The pricing on his alt overs at higher totals is sometimes loose because the sample is thin, and a blowout-driven minute spike pushes him through these alt totals consistently.
The challenge is forecasting the blowout in advance. Closing-line spread is the cleanest forecast tool but it is also priced into the standard bench player’s lines. The genuine edge appears when the spread moves late — a star ruled out an hour before tip-off causes the spread to widen, and the bench-player props on both teams sometimes lag the spread move. The window between the spread adjustment and the props pricing refresh is short but real, and punters who position quickly capture meaningful edge.
The ‘garbage time’ definition that prop punters need
The technical definition of garbage time used by analytics platforms — score margin above 15 with under five minutes remaining — does not always match the operational definition that matters for prop settlement. Coaches sometimes pull starters earlier than the technical definition suggests if the team has a comfortable lead heading into the fourth. Conversely, a 17-point lead with seven minutes remaining sometimes does not trigger starter substitution if the trailing team has been making runs and the coach is not yet confident in the lead.
The operational definition that matters is “the moment when the head coach decides the game is decided.” That decision is influenced by margin, time remaining, opponent personnel and the team’s recent history of holding leads. Coaches who have lost late leads recently are slower to pull starters than coaches who have been comfortable closing games. Tracking these team-specific patterns produces a more accurate blowout forecast than the league-wide spread-based projection.
The most reliable way I have found to track this is through end-of-game substitution patterns over the previous five to ten games for each team. A team whose coach pulls starters at the seven-minute mark of double-digit leads consistently is a team where the blowout effect on prop settlement is large. A team whose coach plays starters through eight or nine minute marks despite double-digit leads is a team where the effect is smaller. The information is publicly available and the work to track it is modest, but few punters do it.
Quarter-specific props and the garbage-time amplifier
UK operators offer quarter-specific prop lines — first-quarter points, second-quarter rebounds, fourth-quarter assists. These markets are useful for navigating the garbage-time problem because they isolate game segments that are not exposed to the blowout effect. A first-quarter points over for a starter is settled before any blowout dynamics kick in, and the projection is cleaner.
The pricing on quarter-specific props is interesting. Overround tends to be heavier than on full-game props — typically 6 to 8 per cent compared to 4.76 per cent — but the operator’s modelling on these markets is sometimes less sophisticated because the sample sizes per quarter are smaller. Specific matchup edges that are subtle at the full-game level are sometimes more pronounced at the quarter-specific level, and the higher overround can be overcome by sharper edges on player-specific quarter performance patterns.
The most valuable use of quarter-specific props is as a hedge against full-game props that are exposed to blowout risk. A starter with a 24.5 full-game points over and a 7.5 first-quarter points over represents an interesting pair: the first-quarter line settles before any blowout dynamics, and a winning first-quarter over partially offsets the risk on the full-game over if the game becomes a blowout and the starter sits late. The hedge is not perfect but it reduces variance meaningfully on full-game prop bets in matchups where blowout probability is elevated.
The competitive-game premium nobody calculates
Competitive games — those that finish within five points — produce systematically higher prop settlements for starters than games of any other final-margin profile. The starters play through the fourth quarter, the offence operates at full intensity, and the late-game stat accumulation is large. A starter projected for 24.5 points in a competitive game often finishes on 27 or 28 because the closing five minutes deliver bonus possessions that the projection averaged across all game-flow scenarios.
The closing-line spread predicts competitive games as well as blowouts. A spread under three points carries roughly 55 per cent competitive-game probability. A spread under five carries 45 per cent. A spread above eight carries less than 20 per cent. The skew is large enough that prop pricing should adjust meaningfully across the spread spectrum, and operator models do adjust — but the adjustment captures the average game-flow effect rather than the specific competitive-game premium.
The over bets on starter props in tight-spread games carry small but consistent positive expected value if the matchup research is otherwise neutral. The reason is that the operator’s pricing reflects average game flow while the punter who has filtered for tight spreads is selecting from a subset of games where the realised stat output runs above average. The edge is small per bet but compounds across the season in matchups that meet the filter.
The starter-pull pattern by team and coach
Coaches differ in how aggressively they pull starters in blowouts, and the differences are stable enough across seasons to be worth tracking explicitly. Some coaches pull starters at the first comfortable opportunity — typically the 5-minute mark of the fourth in a 15-point lead. Others keep starters in until the lead reaches 18 or 20, valuing the rhythm of closing games. The patterns shift as new coaches replace old ones, and tracking the current crop is part of the prop research workflow that pays off.
The way I track this is through a simple table — for each team, what is the average starter minutes played in games where the team has won by 15 or more? The number ranges from around 26 minutes for the most aggressive starter-pulling coaches to around 32 minutes for the coaches who let starters close games. The variation across the league produces a four to six minute swing in how blowout-exposed a starter’s prop settlement is, depending on the coach managing his minutes that night. The usage rate framework sits underneath this — when starters sit, the bench-player usage rates climb, and the cascade is shaped by how aggressively the coach manages minutes.
Operator pricing accounts for some of this team-specific variation, but the modelling is coarse. The pricing on a starter playing for a coach known for aggressive starter-pulling sometimes does not differ enough from the pricing on a starter playing for a coach known for closing games. The under bets on starter props in expected-blowout games carry slightly better expected value when the coach is in the aggressive-pulling category, because the realised minutes will be lower and the stat output correspondingly compressed.
Why this layer of research is worth the work
Garbage time is the kind of factor that prop punters know about in theory but underweight in practice. The full-game prop is the headline market, and most research workflows focus on the components — points, rebounds, assists — at the player level rather than on the structural factor of how the game flow shapes settlement. This is a missed layer.
The punters who beat NBA props long-term build their projections around the dual axes of player performance and game-flow exposure, and the second axis is where the work is least crowded. Game-flow research is unfashionable because it is slow and granular, but it produces some of the cleanest residual edges in the market. The 250,000 unique prop markets posted across the season include thousands of starter props in matchups with elevated blowout probability, and the systematic application of game-flow filters to that volume produces a steady stream of small edges that compound into meaningful annual contribution. The discipline pays. The shortcuts do not.
How do I screen for blowout risk on a specific NBA prop bet?
Closing-line spread is the cleanest single indicator. Above eight points carries roughly 25 per cent blowout probability; above twelve points carries 40 per cent; under five points carries around 8 per cent. Discount over projections accordingly for starters whose minutes are sensitive to game flow. The adjustment is small per game but compounds across the season.
Are quarter-specific props useful for managing garbage-time risk?
Yes — first-quarter and second-quarter props settle before any blowout dynamics kick in, and they isolate game segments not exposed to the late-game starter-pull effect. The overround on quarter props is heavier than on full-game props but operator modelling is sometimes less sophisticated because the sample sizes per quarter are smaller, leaving room for player-specific edges that the full-game model has averaged out.
Why do tight-spread games produce systematically higher starter prop settlements?
In competitive games, starters play through the fourth quarter at full intensity and accumulate stats during the closing minutes. The realised stat output runs above the operator’s projection because the projection averages across all game-flow scenarios while a tight spread filters for the subset where late-game accumulation is highest. The edge is small per bet but compounds in tight-spread matchups.
Written by the editors at nba Best Player Prop Bets.