Pace of Play — Why It Sets the Ceiling for Every Counting-Stat Prop
 Available in US
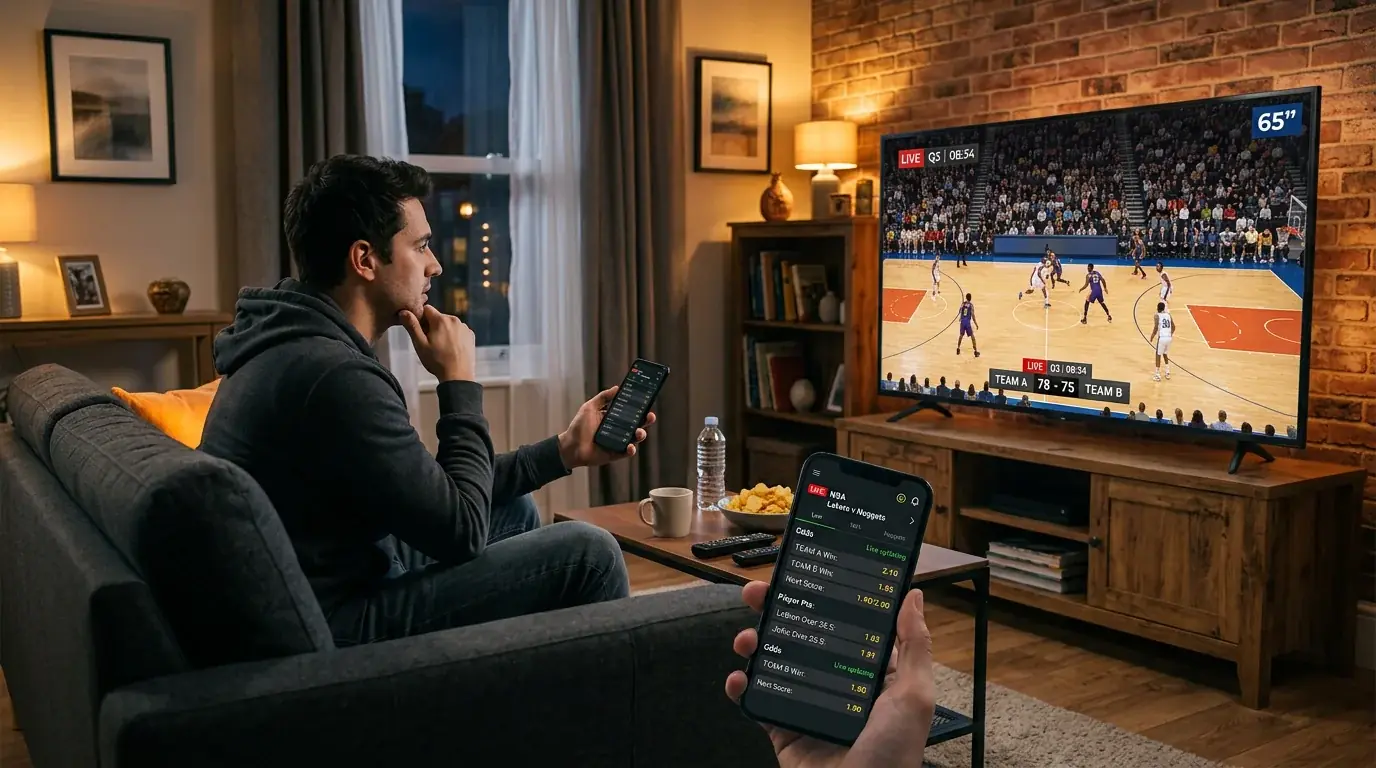
There is a moment every NBA season when I watch a Pacers-versus-Wizards-style sprint and realise the points lines should have been five higher. Not because anyone is shooting well. Because the ball does not stop moving. Pace is not a flashy stat and it is not a strategy stat — it is the size of the pie. Every points prop, every rebounds prop, every assist line, every block and steal, sits inside a fixed number of possessions. If you do not know that number before you bet, you are guessing at the ceiling.
The number that frames every prop on the slate
A possession is one trip down the floor that ends in a shot, a turnover or a foul. A team’s pace is the number of possessions it averages per 48 minutes. The league benchmark sits at roughly 100 possessions per 48 — that is the long-run average around which every team orbits. Top-tier sprinters in the modern NBA push 102 to 104. The slowest ten per cent of teams grind down to 96 or 97.
That four-to-eight possession spread between fast and slow teams sounds small. It is not. Each possession is worth somewhere between 1.10 and 1.20 points league-wide, and on the player level a high-usage star sees roughly a quarter of those possessions filtered through him. A six-possession swing translates directly into one and a half to two extra prop opportunities for a single player, which is the difference between a 24.5 points line cashing on the over versus the under.
Minutes, usage and matchup can collectively shift a player’s stat output by 20 to 30 per cent on any given night, and pace is the silent multiplier on all three. You can have the right read on usage and still lose because the game devolved into a half-court grind that left only 92 possessions for both sides combined. Pace turns research into context.
Pace versus team totals — why one is leading and the other is lagging
People sometimes ask me whether they should just look at the team total instead of the pace. Fair question, wrong answer. Team total is a derived number — it bundles pace with offensive efficiency, defensive efficiency and projected pace adjustment for the specific matchup. Pace is the input.
Two games can have the same projected team total — say, 115 — and behave completely differently for prop purposes. Game A is two efficient halfcourt teams scoring 1.20 points per possession over 96 possessions. Game B is two sloppy run-and-gun teams scoring 1.08 per possession over 106 possessions. The total looks identical. The prop landscape does not.
In Game A, possessions are precious. Stars get a smaller raw count of opportunities, defences set, the clock runs late, and counting-stats compress. In Game B, possessions are abundant. Stars get more touches, fast-break points add up, assists bloom on transition, and rebounds proliferate because there are simply more shots being taken and missed. The points line on the same player should be at least one and a half higher in Game B even though the total is identical.
The lesson: when you look at a prop slip, do not start with the team total. Start with the projected pace. Pace is leading; total is lagging.
How to actually use pace when you are targeting a prop
The targeting rule is straightforward but most punters skip it. Before you commit to an over or an under, calculate roughly how many ending possessions the player will see. Take the team’s projected pace, divide by two for individual side possessions, multiply by the player’s projected on-court share, then multiply by the player’s USG%. The output is the number of possessions the player will personally end. Rough but powerful.
For a 32-minute, 28 per cent usage star on a 102-pace team, the math runs at roughly 100 ending possessions for the team, of which the star is on the floor for two-thirds, of which he ends 28 per cent. That gives you 18 to 19 ending possessions. At 1.15 points per ending, you are looking at a 21 to 22 points projection from raw scoring alone, before you add free-throw bonus or fast-break points. Compare that to the line.
The same logic applies to assists, with one critical adjustment: assists are possessions you create rather than terminate, so the pace effect compounds. A high-pace game gives a primary playmaker more transition opportunities, and transition assists are the highest-value batch for an assists prop because they happen with minimal half-court resistance.
Rebounds track pace differently. A faster pace creates more shot attempts, which creates more missed shots, which creates more rebounds. But a high-pace game also tends to feature longer outlet passes and more transition leakouts, which reduces the rebound chances for rim-runners who would otherwise crash. Pace helps perimeter rebounders more than it helps traditional centres.
Once you have your raw possession count, the next layer is opponent efficiency — how often the defence forces a stop, how often it generates a turnover that ends the possession before a shot. That is where the matchup study sits, and it is where usage rate translates into a real prop projection rather than a season-long average.
The traps that pace sets
I have lost money on pace reads more than once, and the losses follow a pattern. Pace is a long-run average, and any single game can deviate by ten or twelve possessions from a team’s expected number depending on a handful of factors I did not weigh heavily enough.
The first trap is the early-foul scenario. Two starters in foul trouble means a team’s offensive flow stalls, half-court sets get longer, and the projected pace evaporates. You took a points over because you expected 102 possessions; you got 94 and a star who played 26 minutes instead of 35.
The second trap is intentional pace mismatch. Some coaches deliberately slow down against high-pace opponents to disrupt rhythm. The faster team’s projected pace is 103, but the actual game clocks in at 95 because the slower team controlled tempo. Always read the slower team’s tempo, not the faster team’s, when projecting a mismatch — the lower of the two paces tends to dominate.
The third trap is the blowout. A game projected for 102 possessions might genuinely run 102, but the last 12 minutes are bench units in cruise control. Star minutes drop, and the prop projection that counted on 35 minutes of star play falls short on a 31-minute night. Garbage time is a pace trap dressed as a possession total.
The fourth and most subtle trap is the back-to-back. A team on the second night of a back-to-back loses two to four minutes off its star’s expected workload and roughly three per cent off its pace. Both effects compound. A normally fast team on a tired night plays at 98 instead of 102 and runs its star for 32 minutes instead of 36 — that is the double-digit possession swing that flips an over into an under.
What is the league-average NBA pace in 2025–26?
Roughly 100 possessions per 48 minutes. Individual teams range from about 96 at the slow end to 104 at the fast end, with the bulk of the league clustered between 99 and 102.
Does a faster pace always mean more total points?
Not always. Faster pace gives more raw possessions, but if both teams are inefficient the points per possession can be low enough that the total stays modest. Pace tells you the size of the pie; offensive efficiency tells you how rich each slice is. Both have to be read together.
Published by the nba Best Player Prop Bets team.