Minutes Props and DNP Risk — The Hidden Variable Behind Every NBA Prop Bet
 Available in US
Every NBA prop you bet is secretly a minutes bet first. The points line, the rebounds line, the assists line — they all assume a minutes total that the operator’s model has projected, and any divergence from that projection cascades through every prop attached to the player. I have lost more action to unexpected minute restrictions than to any other single factor in twelve years of betting NBA props, and the punters who survive long-term are the ones who treat minutes as the foundation rather than the afterthought.
The DNP that nobody saw coming
A starter is listed as probable an hour before tip-off. The line you bet at three in the afternoon assumed he would play. He gets ruled out at six minutes to tip-off because of a precautionary decision the team did not telegraph. Your stake is voided in some operators and held in others depending on house rules, but the bet is dead either way. This happens to me three or four times per season, and the losses I avoid because I have learned to read pre-game signals are the difference between a profitable year and a breakeven one.
The pre-game DNP is the most extreme version of minutes risk. The harder version to manage is the player who plays but plays significantly less than projected. A starter listed as available who logs 22 minutes instead of his typical 32 collapses every prop tied to his line. The operator’s settled bet pays out on whatever he produced in those 22 minutes, which on average will be roughly two-thirds of what he would have produced in 32 minutes. Over bets die in droves on these compressed nights.
The signals that flag compressed-minute risk before tip-off are usually subtle. A player listed as questionable who is upgraded to probable late in the day has often been told he will be on a minutes restriction. Coaches’ pre-game press conferences sometimes reference “monitoring” or “managing” a player’s minutes, which translates to a 24 to 28 minute ceiling rather than the player’s normal range. These signals are easy to miss for punters who do their research the night before and lock in their slips early. They are easy to catch for punters who watch the day-of news cycle for the last three hours before tip-off.
Load management — the systemic minute compression
Load management has reshaped NBA prop markets over the past five seasons in ways that operators have priced aggressively but that casual punters often still miss. Star players sit on the second night of back-to-backs more often than they used to. Stars sit on the front end of long road trips. Stars sit when the opponent is statistically weak and the team is comfortable absorbing the absence. The pattern is teams managing season-long player health at the cost of individual game quality.
The operator’s model picks up these patterns. Lines on stars’ props on second nights of back-to-backs are typically lower than season averages because the operator’s expected minutes input has been shaved. Lines on early back-to-back nights tend to be slightly elevated because the model expects star availability to be high on the front end. The differential between front and back of back-to-backs in a star’s props can be ten per cent or more on the projection numbers, and this is fully priced in.
Where load management still produces mispricings is in mid-season fatigue patterns that are individual to specific players rather than league-wide patterns. A player coming off a heavy stretch of high-usage games who has not been scheduled for explicit rest but whose body language during recent games suggests fatigue is a candidate for an unexpected minutes restriction. The operator’s model averages these signals across the player base and does not always weight them correctly for specific players. Punters who watch enough basketball to read individual player signs find under bets in this space that operators have not fully priced.
The blowout substitution pattern
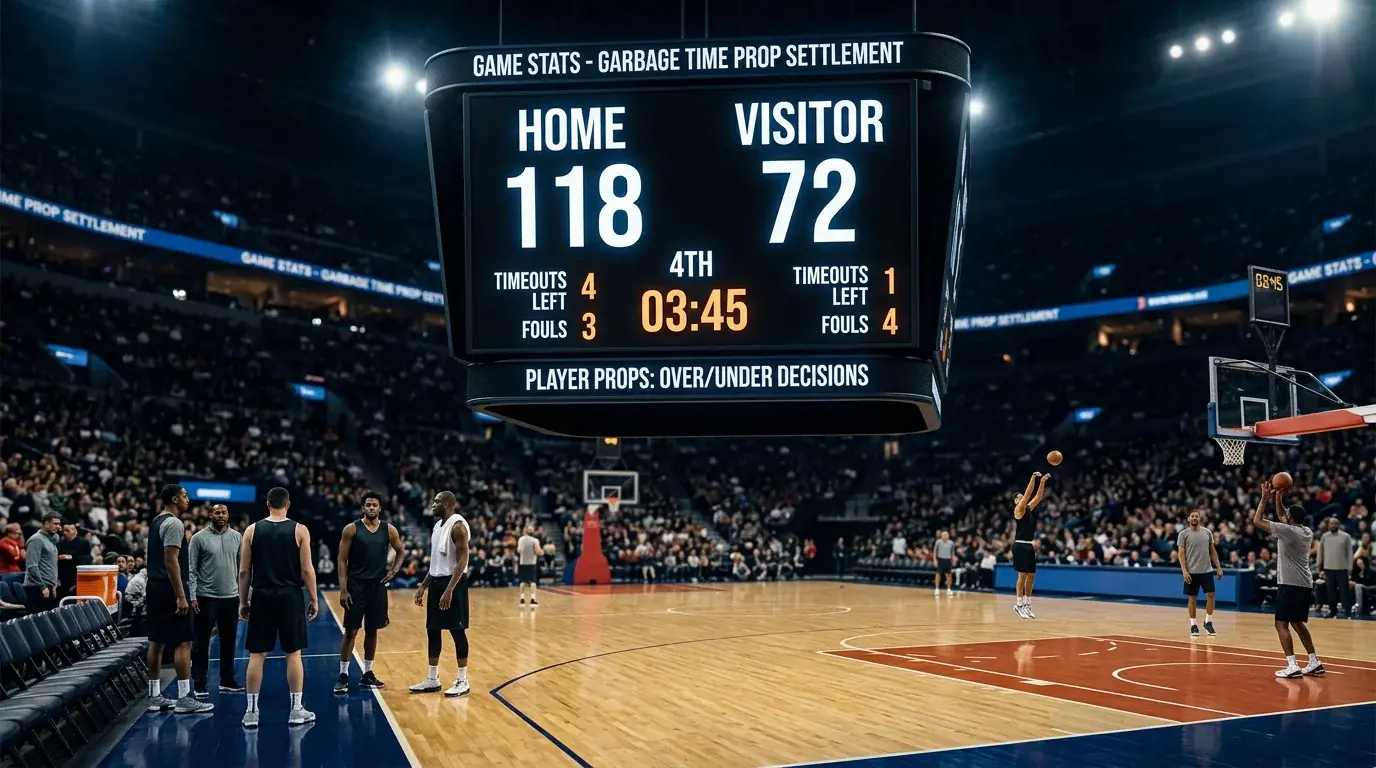
A starter who is on track for a comfortable over through three quarters can have his settlement collapsed by a blowout that pulls him in the fourth. The math is brutal: a starter projected for 11 rebounds at 32 minutes who finishes on 28 minutes because of a blowout settles around 9.6 rebounds. The 10.5 line that looked like a comfortable over at tip-off settles under because the closing minutes never arrived.
I screen for blowout risk on every prop I bet. The closing-line spread is the cleanest indicator. A spread above eight points carries materially higher blowout probability and I discount the projection accordingly. A spread under five points indicates competitive fourth-quarter probability and the projection holds. A spread between five and eight is the gray zone where my discount is partial.
The flip side is that under bets benefit from blowout risk. A player with a 10.5 line in a game that closes at -10.5 has an asymmetric exposure: the over has minute-compression risk and the under does not. This asymmetry is not always priced into operator lines, particularly when the spread moves late and the props pricing has not refreshed. A spread that moves from -7 to -10 in the two hours before tip-off shifts blowout probability meaningfully, and the props pricing sometimes lags the spread move.
Foul trouble — the unforeseen minute killer
Early foul trouble is the minute compression event that nobody can predict reliably. A starter picks up two fouls in the first six minutes, sits the rest of the half, and his projected 32 minutes turn into 22. The pre-game research that produced the prop bet did not foresee this and could not have foreseen it. Foul trouble is genuinely random across short samples, and there is no pre-game signal that flags it reliably.
Where the data shows a meaningful pattern is in matchup style. A team that drives hard and attacks the basket draws more whistles against the opposing defenders. A team that lives on the perimeter draws fewer fouls. Players defending against drive-heavy offences have higher foul-trouble exposure, and that exposure shows up in compressed minutes that hurt every prop tied to those players. The adjustment is small per game but compounds across the season.
The other layer is referee assignment. NBA referee crews vary in their whistle frequency, and the variation is meaningful enough that some punters track it explicitly. A heavy-whistle crew on a drive-heavy matchup produces conditions where foul trouble is roughly 25 per cent more likely than league baseline. A light-whistle crew on the same matchup produces conditions where foul trouble is roughly 20 per cent less likely. Operator pricing models do not consistently incorporate referee data, and punters who do can find small but real edges in this space.
The minutes-prop market itself
UK operators offer minutes lines as a standalone prop. The pricing on these lines is notably tight because the operator’s model is highly accurate at the player level — historical minutes data is comprehensive and the predictive variables are well understood. Standard minutes line overround sits around 4.5 to 5 per cent at 1.91/1.91, comparable to other balanced prop markets.
The edge in the minutes market is rarely on the headline line itself. It is in the alt lines that sit on top, particularly the unders at low minute counts. A starter projected for 32 minutes whose alt under at 25.5 is priced at 3.50 carries a heavier overround than the headline line, but the implied probability of a minutes-compressed game is sometimes lower than the alt price suggests for players who have specific minute-restriction risk that the operator’s model has not fully factored in.
The way I trade the minutes market is as a hedge rather than a primary play. If I have over bets on a player’s other props that are sensitive to minutes, a small under bet on his minutes alt provides a partial hedge against the minute-compression scenario. The hedge is imperfect because the correlation is not 1.0, but it is strong enough that the hedge reduces variance materially without consuming all the expected value of the original prop bets. The in-play side of this hedging opens up additional flexibility because live lines update as actual minutes accumulate.
Two-way contracts and the 50-game ceiling
The two-way contract structure imposes a 50-game NBA cap on certain players regardless of their minutes per game. A two-way player who has hit his cap stops appearing in NBA games and shifts entirely to the G League affiliate, and his NBA prop markets disappear. The punters who track two-way usage carefully know which players are approaching their caps and adjust their research accordingly.
The 50-game ceiling at the $636,435 minimum two-way salary for the 2025-26 season puts pressure on coaches to manage two-way appearances strategically. Some coaches use two-ways exclusively for emergency injury cover. Others rotate them through scheduled appearances to spread the cap evenly across the season. The pattern matters for prop pricing because operator models sometimes lag the team-specific deployment strategy and price two-way props as if appearances were random rather than systematic.
The most reliable edge here is the late-season under on two-way players approaching their cap. A player who has used 47 of his 50 games by late February is going to be deployed sparingly through the rest of the regular season. Operator props that have not been adjusted for this constraint produce slight overpricings on his upcoming appearances. The volume is low because two-way players have small markets to begin with, but the edges are clean when they appear.
Reading minutes risk across a research workflow
Every prop research workflow needs a minutes filter at the front end. Before I evaluate any other variable on a prop bet, I project the player’s minutes and compare it to the operator’s implicit projection. If my minutes projection is materially below the operator’s, I either pass the bet entirely or look for the under side of the line rather than the over. If my projection matches or exceeds the operator’s, I proceed to the deeper analysis on the specific stat category.
The data I use for this workflow is straightforward: rolling minutes averages over the last 10 games, weighted heavier on the most recent five; pre-game injury report status; pre-game press conference references to minute management; matchup-specific blowout risk based on closing spread; and any specific load-management pattern the team has shown for the player. None of these inputs is exotic. All of them are publicly available for any UK punter who watches the day-of news cycle. The discipline is in applying them consistently rather than skipping them when the rest of the prop research looks compelling.
The punters who beat NBA props long-term are the ones who recognise that minutes is the foundation rather than the afterthought. Every other variable sits on top of minutes. A perfect read on a player’s matchup, role and form is worthless if his minutes turn out 25 per cent below projection. The minutes work is unglamorous and tedious. It is also the layer of research that produces the largest single factor improvement in prop bet outcomes for punters who get it right consistently.
How do I avoid surprise DNPs that void or kill prop bets?
Watch the day-of news cycle in the three hours before tip-off, not just the night before. Players upgraded from questionable to probable late are often on minute restrictions. Coaches’ pre-game press conferences reference ‘monitoring’ or ‘managing’ players whose minutes will be capped. These signals are missed by punters who lock slips early and caught by punters who refresh their research close to tip-off.
Are minutes alt lines worth betting as standalone props?
Standalone minutes alt lines are useful primarily as hedges against minute-compression risk on other props rather than as primary plays. The unders at compressed minute counts can be priced loosely on players with specific minute-restriction risk that the operator has not fully factored in, but the volume of clean edges in this market is low and the overround on alts is heavier than on headline lines.
How does load management change minutes-projection research across the season?
Operator pricing has aggressively absorbed standard load-management patterns — back-to-backs, long road trips, weak-opponent rest. The mispricings now appear in mid-season fatigue patterns specific to individual players rather than in the league-wide patterns. Punters who watch enough basketball to read individual player fatigue signs find under bets that operators have not fully priced.
Written by the editors at nba Best Player Prop Bets.