Three-Point Variance — Why Threes Props Lose More Punters Than Any Other NBA Market
 Available in US
I have been pricing NBA props for over twelve years and I will tell you, without hedging, that threes-made props are the single most punishing market on a UK slip. Punters love them because the maths feels intuitive — a 38 per cent shooter taking nine attempts should hit three or four, right? Wrong. The variance on a binary 38 per cent attempt across nine trials is enormous, and the gap between perceived edge and realised edge is where most prop bankrolls quietly bleed out. If you take one thing from this article, take this: threes are the market where statistical literacy matters most, and where the biggest leak in your prop strategy almost certainly lives.
Table of Contents
The binomial maths most punters skip past
A three-point shot is a Bernoulli trial. Either it goes in or it does not. Across an evening’s work, a shooter takes some number of attempts at a particular hit rate, and the distribution of made threes follows a binomial pattern that has been understood for two centuries. The maths is not difficult. The problem is that most prop punters have never sat down and worked through what the distribution actually looks like for a typical NBA shooter on a typical night.
Take a player attempting nine threes at a 38 per cent hit rate — a profile that fits dozens of NBA rotation pieces. The expected value of made threes is 3.42. The probability the player hits exactly four or more is around 47 per cent. The probability he hits two or fewer is around 31 per cent. That is a 31 per cent chance of going under a 2.5 line that intuitively looks like a comfortable over for a competent shooter on a high-volume night. Three out of ten times, the math says he goes under. Punters who treat the line as a coin-flip on shooter quality lose money over time even when their read on the player is correct.
The variance widens the more you scale attempts. At fifteen attempts and 38 per cent — a Trae Young or Curry-style night — the standard deviation around the expected value is 1.88 made threes. That means even on a heavy-volume game where the shooter takes the shots you expected him to take, the result distribution is wide enough that a 5.5 line can settle anywhere from two to nine without anything unusual happening on a specific game. Prop traders price this variance in. Punters frequently do not.
Why operators love a threes line at 1.91
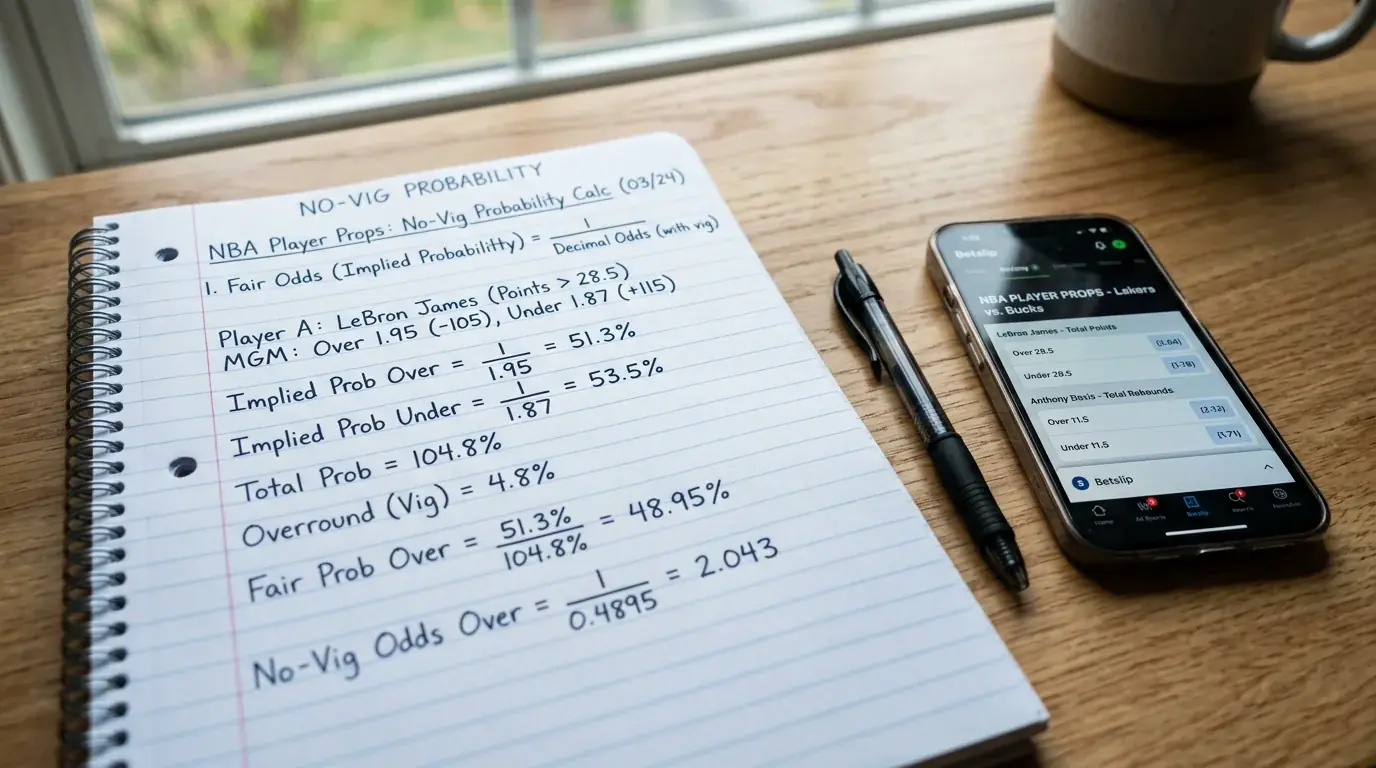
Operators price threes props with full awareness of the variance, and the standard 4.76 per cent overround at 1.91/1.91 sits comfortably on top of a probability estimate that is already wider than the punter typically thinks. Player-prop volume is enormous — basketball props made up roughly 25 to 30 per cent of basketball handle by 2025, up from around 15 per cent a few years earlier — and threes sit near the top of that volume by line count. Out of the 200 to 250 prop lines the average UK operator posts on a given match night, threes typically account for between fifteen and twenty per fixture once alts are included.
The pricing model an operator runs blends shooter rate, expected attempts, opponent three-point defence, pace and a small adjustment for late-game garbage time scoring. Once those inputs are converted into a probability estimate, the line is set such that the overround sits within target. The crucial thing to understand is that the model price already accounts for variance — the operator is not betting on the shooter making threes, the operator is offering an over and an under that together trap the implied probability of the binomial outcome plus the margin.
That is why threes lines tend to feel “tight” relative to other prop markets. They are not tight because the operator is being conservative. They are tight because the underlying probability distribution is wider than the punter’s mental model assumes, and the operator’s price reflects the mathematical reality rather than the punter’s gut.
The volume trap that catches sharp eyes
Picture this from my own files. A few seasons back I had what looked like a clean read on a back-up shooter promoted to a starting role for a stretch of injury cover. His attempts profile was rising — eight to ten threes per game, up from three or four in his bench role — and his hit rate had held at 39 per cent across a workable sample. The 2.5 over at 1.85 looked like value. I took it eight games running. Result: 4-4. The hit rate dropped to 35 per cent over that stretch, which on its own would have hurt, and on top of that two of the four losses came on six-attempt nights where his usage compressed because of late-game flow rather than role design.
What I learned: attempt volume is not stable enough across an injury-cover stretch to underwrite a simple over bet. The shooter’s role expanded, but the shape of his attempts did not. When the team led, his shots dried up. When the team trailed badly, his attempts inflated but his shot quality dropped because the offence broke down. The 2.5 over priced 1.85 was not value. It was variance plus a small operator margin, packaged in a way that looked like a clean angle.
That episode pushed me into the habit I have kept ever since: never bet a threes prop on attempt projection alone. The attempt count has to come with a story about where in the game the attempts are coming from, against which defensive coverage, and at what point in the night. Without that narrative layer, attempt volume is a hollow number that the operator’s model has already priced.
Defensive matchups and the closeout problem
Three-point defence is the most over-discussed and most under-modelled element of threes props. Every prop preview talks about opponent three-point percentage allowed. That metric is largely noise. What actually matters is the defensive scheme — how the opponent guards the pick-and-roll, how aggressively their wings closeout, how their drop coverage forces or prevents corner threes, and how their switching profile aligns with the specific shooter’s release point.
A drop-coverage defence with passive bigs gives a pull-up shooter clean looks above the break. A switching defence puts a smaller guard on a tall shooter and gives him an inch of release space he does not get against length. A team that hard-shows on screens forces the shooter into rushed pull-ups that look like the same shot but convert at materially lower rates. The opponent’s overall three-point percentage allowed averages all of this together. The matchup-specific picture varies by ten percentage points or more from the season average, and the operator’s pricing model captures that variance even when the punter’s research does not.
The corner three is a separate category. Corner attempts convert at higher rates league-wide because the corner sits closer to the basket. A defence that funnels offence into corners is giving up a higher-percentage shot than a defence that locks down corners and forces above-the-break attempts. When you are reading a threes prop, you want to know what proportion of the shooter’s expected attempts are corner shots versus above the break. That mix moves the realised hit rate by two to four percentage points routinely.
Pace, possessions and the inflation effect
Pace is the most direct lever on threes prop attempts. League average pace sits around 100 possessions per 48 minutes, and a shooter playing 32 minutes at that pace gets an attempt opportunity profile that looks one way. Move that game to 105 possessions — a Pacers-Warriors-style fixture — and the same shooter gets roughly 12 to 15 per cent more attempts on the night without anything else changing in his role. That is the difference between an 8.0 attempt projection and a 9.0 attempt projection, and at the margin it shifts a 2.5 over from neutral expected value to slightly positive.
Pace forecasts depend on opponent profile as well as team profile. A high-pace team facing a low-pace opponent reverts toward the slower team’s pace because possessions are shared. The operator’s pricing model uses the harmonic-mean pace of the two teams in most cases, and the punter’s pace estimate should do the same. Reading only the over team’s pace produces inflated attempt projections that look favourable until they do not pay.
Extreme pace matchups — two top-five pace teams meeting two bottom-five pace defences — are where threes overs carry the largest pricing dislocations relative to season averages. They are also where the lines are tightest, because operator models pick up the same signal. The edge is real but small.
How I price a threes prop in practice
My workflow on threes is the most disciplined of any prop market I bet. Step one is the attempts projection — three years of attempts per minute under the current role, adjusted for opponent pace and game-script expectation. That gives me a baseline attempts number. Step two is the hit-rate adjustment — last 30 games, weighted heavier on the last 10, with a defensive matchup overlay based on how the opponent has guarded similar release profiles. Step three is the binomial calculation — given attempts and hit rate, what is the probability the player hits over the line? Step four is comparison with the operator’s implied probability and decision based on edge.
If the calculated edge is below 3 per cent, I pass. If it is between 3 and 5 per cent I take it small. If it is above 5 per cent I take it at standard size. If it is above 8 per cent I look for an error in my model before increasing size, because edges that large in liquid prop markets are usually an indication that I have miscalculated something rather than that the operator has mispriced. This is the discipline that separates threes punters who survive long-term from those who do not. The mathematical structure is well understood. The only question is whether the punter respects it.
The relationship between threes pricing and broader market mechanics also touches on how usage rate shapes attempt volume, which is the input feeding everything else in the model. A shooter’s three-point line is downstream of his role in the offence, and role changes upstream of the line price are the most reliable source of mispricing — but those changes have to be tracked actively rather than assumed.
Reading the variance correctly is the whole game
The punters who beat threes props long-term are not the ones with the best feel for shooters. They are the ones who respect the maths of binomial distributions and who build models that account for variance properly. The market is liquid, the lines are sharply priced, and the room for error is small. But the room exists, and the punters who find it are the ones who understand exactly why the line is where it is rather than where it intuitively should be.
The single biggest mistake I see in this market is treating the line as a midpoint. It is not. The line is where the operator’s overround sits balanced on top of an asymmetric probability distribution, and the punter’s job is to understand that distribution well enough to identify the spots where the operator’s calibration is slightly off. Those spots exist. They are not where the obvious narrative angles are. They are in the places where pace, role, matchup and shooter form converge in ways that the operator’s model has not fully captured. That is the work, and it is the only work that matters.
Why is the variance on three-point props so much higher than on points props?
Threes are a small-sample binary outcome — usually somewhere between five and twelve attempts at a 33 to 40 per cent hit rate — which produces a wide binomial distribution around the expected value. Points are a continuous-style outcome with multiple shot types contributing, which smooths variance considerably. A 20-point projection has a much tighter distribution around the line than a 2.5 threes line that depends on individual shot outcomes.
Are three-point alt lines beatable for UK punters?
Beatable in theory but the operator margin embedded in alt prices is materially higher than the margin on headline lines. Alt lines at long prices typically carry 12 to 18 per cent overround compared to the 4.76 per cent on a balanced 1.91 line. Long-run profitability on alts requires a model that consistently identifies pricing errors larger than that overround, which is a high bar. Most punters who bet alts on intuition lose long-run.
How much does opponent three-point defence actually matter for prop pricing?
Opponent percentage allowed on its own is largely noise. What matters is the defensive scheme — closeout aggression, switching profile, drop coverage, corner versus above-the-break shot allocation — and how that scheme aligns with the specific shooter’s release profile. Matchup-specific impact moves expected hit rate by two to four percentage points routinely, sometimes more in extreme schematic mismatches.
Written by the editors at nba Best Player Prop Bets.